- 3 replies
- 4,650 views
- Add Reply
- 0 replies
- 1,781 views
- Add Reply
- 0 replies
- 5,377 views
- Add Reply
- 0 replies
- 10,362 views
- Add Reply
- 0 replies
- 1,066 views
- Add Reply
Lyzenga Algorithm for Shallow Water Mapping

By Agha,
Hello folks!
I am trying to use the Lyzenga Algorithm for estimating the depth of water in shallower areas, probably depths under 8-10 meters of lakes.
First of all, how accurate is this algorithm in practice?
Secondly, lets say i have the band values. can someone explain me how to retrieve those depths?
I am following the "Lyzenga Algorithm for Shallow Water Mapping Using Multispectral Sentinel-2 Imageries in Gili Noko Waters" paper, but there are 3 steps of getting NDWIs, NDCIs a
The Transformative Impact of GIS Mapping in Humanitarian Assistance

By IRES,
Understanding GIS Mapping
GIS Mapping is a technology and process used to capture, store, analyze, manage, and visualize geographic or spatial data. It combines geographical information such as locations and terrain features, with various types of data like environmental, social, economic, and demographic information, to create detailed and layered maps. These maps are powerful tools for understanding and interpreting spatial relationships, patterns, and trends.
Components of GI
TinyVQA, a compact multimodal visual question

By Lurker,
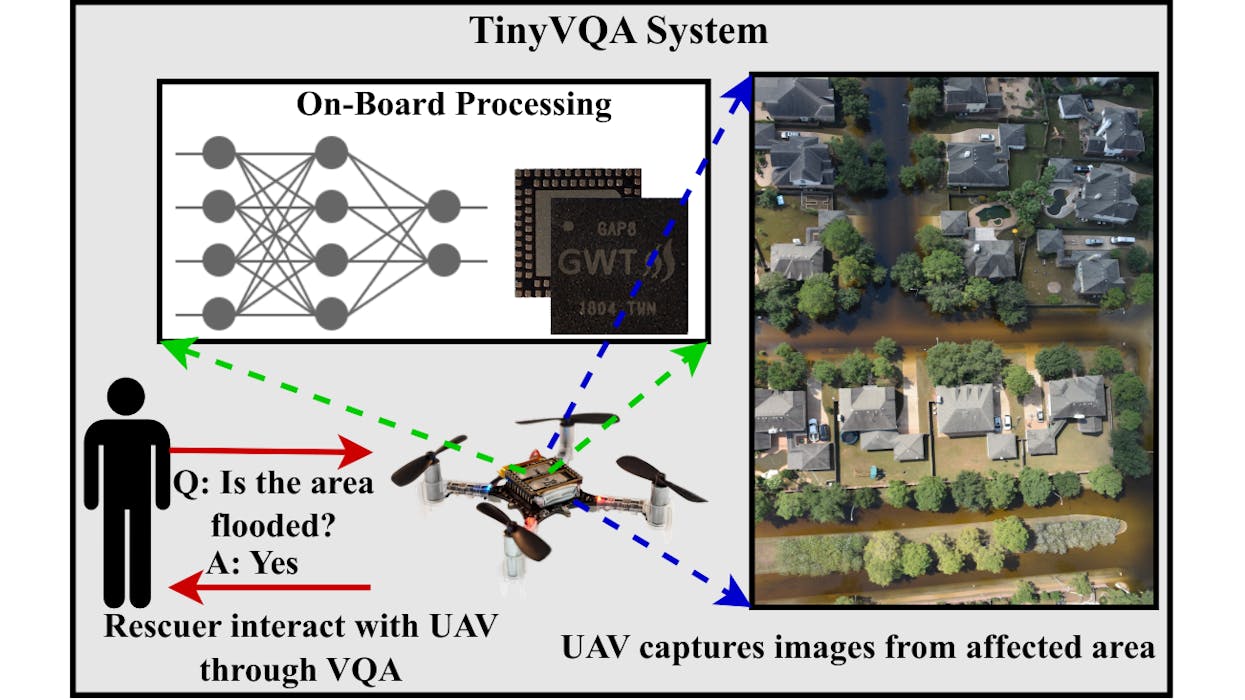
Multimodal machine learning models have been surging in popularity, marking a significant evolution in artificial intelligence (AI) research and development. These models, capable of processing and integrating data from multiple modalities such as text, images, and audio, are of great importance due to their ability to tackle complex real-world problems that traditional unimodal models struggle with. The fusion of diverse data types enables these models to extract richer insights, enhance decisi
AI Generates 3D City Maps From Single Radar Images
By Lurker,
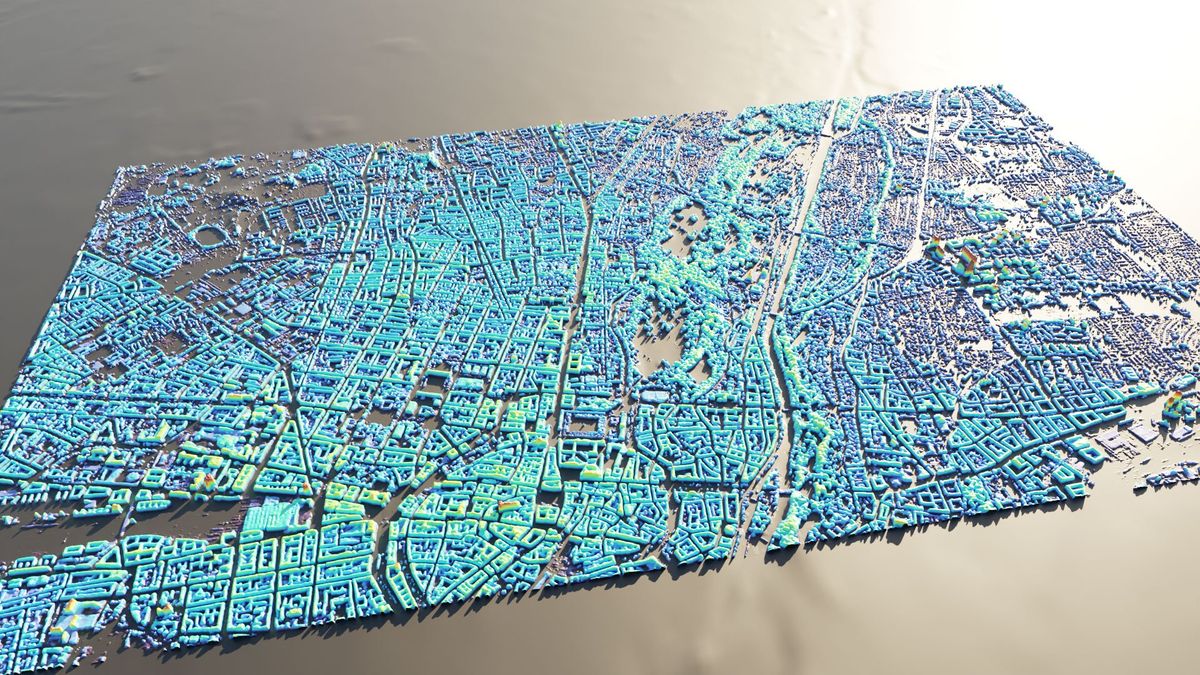
A new machine learning system can create height maps of urban environments from a single synthetic aperture radar (SAR) image, potentially accelerating disaster planning and response.
Aerospace engineers at the University of the Bundeswehr in Munich claim their SAR2Height framework is the first to provide complete—if not perfect—three-dimensional city maps from a single SAR satellite.
When an earthquake devastates a city, information can be in short supply. With basic services disrupte
AI reveals secret roads endangering the world's rainforests
By Lurker,
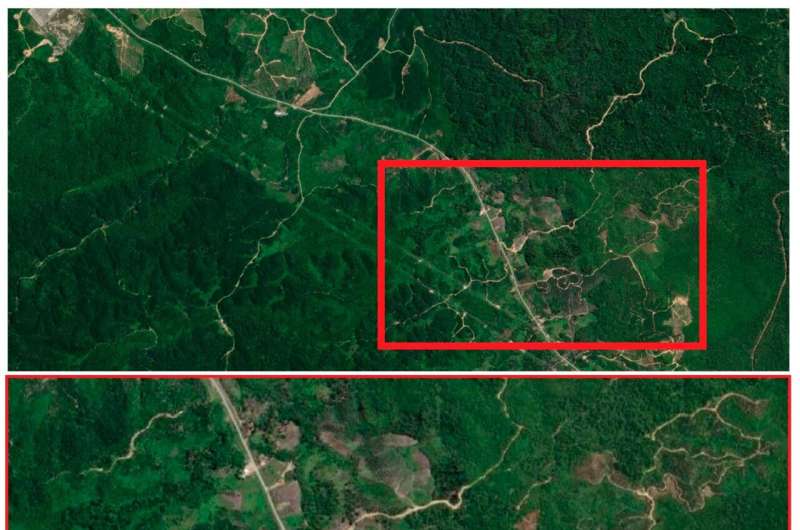
Satellite images analyzed by AI are emerging as a new tool in finding unmapped roads that bring environmental destruction to wilderness areas.
James Cook University's Distinguished Professor Bill Laurance was co-author of a study analyzing the reliability of an automated approach to large-scale road mapping, using convolutional neural networks trained on road data, using satellite images.
He said the Earth is experiencing an unprecedented wave of road building, with some 25 million kil
-
Forum Statistics
8.8k
Total Topics43.5k
Total Posts
-
Latest Posts
-
A new study introduces the Community Land Active Passive Microwave Radiative Transfer Modeling platform (CLAP)—a unified multi-frequency microwave scattering and emission model designed to revolutionize land surface monitoring. This cutting-edge platform combines active and passive microwave signals to offer potentially accurate simulations of soil moisture and vegetation conditions. By incorporating advanced interaction models for soil and vegetation, CLAP has the potential to address key limitations in existing remote sensing technologies, enabling the improvement of land monitoring precision. The study showcases CLAP's ability to improve microwave signal simulations, especially at high frequencies, marking a major step forward in ecosystem management and climate change research. Microwave remote sensing is essential for land monitoring, providing crucial insights into soil moisture and vegetation health by measuring the microwave radiation and backscatter emitted and scattered by the surface. However, current models rely heavily on zeroth-order radiative transfer theory and empirical assumptions, often overlooking dynamic changes in vegetation and soil properties (structure, moisture and temperature). These limitations result in inconsistencies and reduced accuracy across different frequencies and polarizations. Given these challenges, there is an urgent need for more refined research into the scattering and emission mechanisms of multi-frequency microwave signals to improve the precision and reliability of remote sensing technologies. A team of researchers from the University of Twente has published a paper in the Journal of Remote Sensing, introducing the Community Land Active Passive Microwave Radiative Transfer Modeling platform (CLAP) a multi-frequency microwave scattering and emission model, which integrates advanced soil surface scattering (ATS+AIEM) and vegetation scattering (TVG) models. CLAP incorporates appropriate vegetation structure, dynamic vegetation water content (VWC) and temperature changes, significantly improving upon existing technologies. Additionally, CLAP uncovers the frequency-dependent nature of grassland optical depth and highlights the significant impact of vegetation temperature on high-frequency signals, offering new insights for more accurate vegetation and soil monitoring. The core strength of CLAP lies in its detailed modeling of soil and vegetation components. The team used long-term in situ observations from the Maqu site, including microwave signals, soil moisture, temperature profiles, and vegetation data, to drive CLAP and evaluate the model performance respectively. Results showed that during the summer, CLAP with cylinder parameterization for vegetation representation simulated grassland backscatter at X-band and C-band with RMSE values of 1.8 dB and 1.9 dB, respectively, compared to 3.4 dB and 3.0 dB from disk parameterization. The study also discovered that vegetation temperature variations significantly affect high-frequency signal diurnal changes, while vegetation water content changes primarily influence low-frequency signals. For example, at C-band, vegetation temperature fluctuations had a greater impact on signal changes (correlation coefficient R of 0.34), while at S-band, vegetation water content had a stronger influence (R of 0.46). These findings underscore the importance of dynamic vegetation and soil properties in microwave signal scattering and emission processes, which CLAP accurately reflects. Dr. Hong Zhao, the lead researcher, commented, "The CLAP platform represents a major advancement in microwave remote sensing. By incorporating appropriate vegetation structure, dynamic vegetation and soil water content and temperature into the model, CLAP offers a more accurate representation of microwave signal scattering and emission processes. This innovation will significantly enhance our ability to monitor vegetation and soil conditions, providing more reliable data for ecosystem management and climate change research." The team utilized extensive in situ data from the Maqu site as well as satellite microwave observations. These comprehensive datasets allowed the researchers to rigorously assess CLAP's performance across various frequencies and polarizations, ensuring its accuracy and reliability. The development of CLAP opens new possibilities for the future of microwave remote sensing. This technology can be integrated into upcoming satellite missions such as CIMR and ROSE-L to enhance the precision of soil moisture and vegetation monitoring. Additionally, CLAP can be incorporated into data assimilation frameworks to provide more accurate inputs for land surface models. The widespread application of this technology promises to have a profound impact on global environmental monitoring, agricultural production, and climate change research, supporting sustainable development efforts worldwide. source: https://dx.doi.org/10.34133/remotesensing.0415
-
Researchers at Aalto University have, for the first time, investigated the occurrence of wolverines across the whole of Finland using satellite imagery, field measurements, and snow track observations. The wolverine, a predator typically found in the fells and forests of northern Finland, was classified as endangered in the country already in the 1980s. Although information on the species' historical range is limited, wolverines are known to have inhabited southern Finland as recently as the 19th century. Hunting caused the species to disappear from the region. This study, published in the journal Ecology and Evolution, is the first to provide nationwide data on the types of habitats favored by wolverines as they expand into new areas. "The species is returning to its historical range in southern Finland. According to our research, the deciduous-dominated mixed forests typical of the south may be more important habitats for wolverines than previously thought," says Pinja-Emilia Lämsä, a doctoral researcher at Aalto University. Despite recent population growth, the wolverine's survival remains threatened by its small population size, low genetic viability, and fragmented distribution. However, the study's use of remote sensing and field data offers vital information for safeguarding biodiversity. "Understanding habitats is essential for improving species conservation and management," says Professor Miina Rautiainen, a remote sensing expert at Aalto University. Fragmentation of forest landscapes poses a threat The study found that wolverines tend to favor large, forested areas with deciduous trees. They were rarely observed near recent clear-cuts, whereas older felling sites—about 10 years old—were more attractive. Wolverines also preferred areas with less dense tree cover. Previous studies on wolverine habitats and distribution have mainly focused on mountainous regions with vegetation that differs significantly from the low-lying boreal forests of Finland. According to Pinja-Emilia Lämsä, it is crucial to understand which habitats wolverines prefer specifically in Finland, where forestry practices strongly influence forest structure. "In Finland, the average forest compartment—a uniform section of forest in terms of tree species and site conditions—is relatively small. This can lead to a patchwork-like fragmentation of forest landscapes in forest management decisions. To protect wolverine habitats, mixed-species forest should be prioritized and large, continuous forest areas preserved," Lämsä says. Remote sensing reveals impacts of environmental change The study, conducted in collaboration with the Natural Resources Institute Finland (Luke), combined snow track counts of wolverines with national forest inventory data based on satellite images and field measurements. This approach allowed the researchers to examine the influence of forest characteristics on wolverine presence on a large scale. According to Rautiainen, remote sensing is an excellent tool for studying the distribution of animal species across broad areas, as satellite and aerial images provide increasingly detailed information about changes in forest landscapes and their impacts on wildlife. "In the future, remote sensing will enable us to monitor in even greater detail how, for example, changes in vegetation or other environmental factors in Finland affect animal populations," Rautiainen says. source: https://dx.doi.org/10.1002/ece3.71300
-
We’ve all experienced that moment of frustration when the GPS glitches and you miss an exit on the highway. The team at Tern AI, which is building a low-cost GPS alternative, says that’s because the current technology is limited by its reliance on satellite positioning. Tern AI says it has figured out how to locate the position of a vehicle using only map information and a vehicle’s existing sensor data. The company’s pitch: It’s a cheap system that doesn’t require any additional expensive sensors. “No triangulation, no satellites, no Wi-Fi, nothing. We just figure out where we are as we drive,” Brett Harrison, co-founder and president, told TechCrunch while Cyrus Behroozi, senior software developer at Tern, loaded up the demo on his iPhone. “That’s really game changing because as we move away from triangulation-based, which limits technology, now we have the ability to be fully off that grid.” Harrison says this breakthrough is important for a number of reasons. From a commercial standpoint, companies that rely on GPS — including ride-hail apps to delivery companies — lose time, money, and gas every time their drivers have to double back because of faulty GPS positioning. More importantly, our most critical systems — from aviation to disaster response to precision farming — rely on GPS. Foreign adversaries have already demonstrated that they can spoof GPS signals, which could have catastrophic impacts both on the economy and national security. The U.S. has signaled that it wants to prioritize alternatives to GPS. During his first term, President Donald Trump signed an executive order to reduce reliance on a single source of PNT (positioning, navigation, and timing) services, like GPS. There are also several other initiatives which direct agencies and bodies like the Department of Defense and the National Security Council to ensure resilient PNT by testing and integrating non-GPS technologies. Testing Tern’s system in Austin To start the demonstration, Behroozi connected his 2019 Honda Civic to his phone via Bluetooth, allowing the Tern application to pull in data from the vehicle’s existing sensors. He noted that Tern’s tech can be integrated directly into vehicles, beginning model years 2009 and up. Usually, Tern sets the position manually to speed things up, but for our demo, the team wanted a “cold start.” Behroozi turned off his phone’s location services, so the Tern intelligent system had only a cached map of a 500-square-mile boundary around Austin and vehicle sensors to work with. As the car drove, the system picked up road data to work toward “convergence.” It took roughly 10 minutes for the system to reach full convergence from a cold start because, according to Behroozi, there was traffic so our movements were limited. Harrison assured me convergence usually takes around one to two minutes without a start point, and is immediate with one. Harrison noted that Tern’s system can also localize vehicles in parking garages, tunnels, and on mountains, which GPS struggles to do. Harrison wouldn’t explain exactly how, saying the information is “proprietary.” We drove around for a few more minutes after the system reached full convergence, and I watched as it steadily tracked our precise movements in a way that appeared as good as, and in some cases better than, GPS. That became more apparent when we drove into downtown Austin, where my Google Maps regularly mislocated me throughout the week as I navigated urban streets dotted with towering buildings. Harrison said that Tern’s system is also safer from a privacy perspective. “Our system is a total closed loop,” he said. “Right now, we’re not emitting anything. It’s independently deriving its own position [via on edge computing], so there are no external touchpoints.” source: techcrunch.com
-
Sony announced the AS-DT1, the world’s smallest and lightest miniature precision LiDAR depth sensor. Measuring a mere 29 by 29 by 31 millimeters (1.14 by 1.14 by 1.22 inches) excluding protrusions, the Sony AS-DT1 LiDAR Depth Sensor relies upon sophisticated miniaturization and optical lens technologies from Sony’s machine vision industrial cameras to accurately measure distance and range. The device utilizes “Direct Time of Flight” (dToF) LiDAR technology and features a Sony Single Photon Avalanche Diode (SPAD) image sensor. As Sony Semiconductor Solutions Corporation describes, a SPAD sensor promises exceptional photon detection efficiency, ensuring the sensor can detect even very weak photons emitted from the light source and reflected off an object. This efficiency is crucial, as reflected light is precisely how LiDAR works. Light Detection and Ranging (LiDAR) measures distances by measuring the time it takes for emitted photons to bounce off an object and return to the sensor. The more efficient the image sensor in terms of photon efficiency, the better its accuracy. Compared to the CMOS image sensors that photographers are familiar with, which detect light by measuring the volume of light that accumulates inside individual pixels over a specified time frame, SPAD sensors can detect a single photon — SPAD sensors digitally count photon particles without accuracy or noise issues. SPAD image sensors are fundamentally different and significantly more efficient than CMOS sensors. So why don’t all cameras use SPAD sensors? While they are very good at measuring single photons, they are not well-suited to measuring much more light, which nearly everyone wants to capture with a traditional camera. They are also costly, not high resolution, and inflexible. It was big news when Canon unveiled a one-megapixel SPAD sensor less than five years ago, to help illustrate where the technology is in terms of resolution. Sony does not say much about the specific SPAD sensor in its new AS-DT1 LiDAR Depth Sensor. There aren’t many SPAD sensors in Sony’s sensor catalog, but the few that are there are small and have relatively few pixels. Nonetheless, Sony is high on its new AS-DT1 device. Due to its small size and impressive SPAD sensor, the company says it is “ideal for applications where space and weight constraints are paramount, including drones, robotics, and more.” It is reasonable to suspect the device could also be helpful in self-driving cars. Any situation needing very accurate depth and distance measurements in challenging lighting scenarios is well-suited to something like the AS-DT1. “The AS-DT1 can measure distances to low-contrast subjects and objects with low reflectivity, which are more difficult to detect with other ranging methods. This enables accurate measurement of distances in diverse environments, such as retail stores, where various objects, including people and fixtures, are expected,” Sony explains. “In addition to its ability to accurately measure distances both indoors and outdoors, the sensor’s compact, lightweight design and rigid aluminum housing allow for integration into a wide range of devices, such as food service robots in restaurants, autonomous mobile robots in warehouses, and drones used for inspections and surveys.” The Sony AS-DT1 can measure at various distances with exceptional accuracy. For example, Sony claims it can measure the distance to objects 10 meters (32.8 feet) away with a margin of error of five centimeters (nearly two inches) indoors and outdoors. The company further claims the AS-DT1 is superior to competing imaging devices when dealing with low-contrast subjects, objects with low reflectivity, and floating objects. The AS-DT1 can accurately measure up to 40 meters (131.2 feet) indoors and 20 meters (65.6 feet) outdoors under bright summer conditions, which Sony says can be challenging “when inspecting infrastructure such as bridges, highways, and dams.” Given its small size and how valuable drones are for infrastructure inspection, this is a particularly attractive use case for the AS-DT1. source: petapixel
-
-
Latest Topics
-
-
Recent Achievements


