- 17 replies
- 9,756 views
- Add Reply
- 2 replies
- 2,319 views
- Add Reply
- 11 replies
- 1,910 views
- Add Reply
- 0 replies
- 1,175 views
- Add Reply
- 6 replies
- 5,342 views
- Add Reply
extraction of built-up area from images

By imtest133,
Dear all
I'm new in remote sensing and I have problems when try to extract built-up area from an image or during image classification.
I am using landsat 7 ETM+ and TM images, when I use supervised or un-supervised methods for image classification, urban area (built-up area) are not recognizable from bare-soil.
I read several papers about built-up Indexes and tried some of them but there is no tangible improvement in results.
Please guide me as step by step process.
Regards
Online Cartography with multiple satellite imagery

By intertronic,
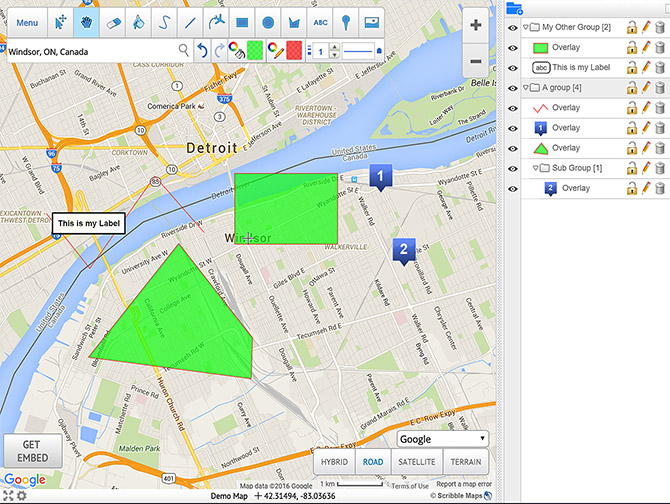
Hi, I just want to share this site for online cartography
https://www.scribblemaps.com/
here if you want to try to directly create the map
https://www.scribblemaps.com/create/
it's a simple but quite powerful site where you get satellite imagery (google and bings), maps and you can draw features over it. The online tool gives you the opportunity to change design and style of the background and to digitalize some polygons, points etc. The software gives you the ability to import
Req : DSM (Digital Surface Model) Generated from satellite imagery
By intertronic,
Hi everyone,
does anyone knows how to generate a digital surface model with some satellite imagery? it's possible to create a terrain from stereo imagery in ArcGIS? and with just f.ex. 3-5 images not stereo?
References :
https://en.wikipedia.org/wiki/Digital_elevation_model
Graphs with values in maps and multiple attribute information:

By veegee,
Dear friends,
I have two data sets; 1). village information of water quality analysis 2). animal farming details(breeds of animals- like Chicken, Hen, Cattles)
Requirement:
i). Put graphs with values (histogram/bar chart) in the maps.
ii). Multiple attribute information for animals details for each village.
Need clarifications for the following:
1. For bar chart/ histogram is it possible to put the values on the graph on respective administrative boundary?
2. Is it possi
Free Erdas Imagine Spatial Modeler Library

By darksabersan,

Hi guys,
I found some interesting Free Erdas Imagine Spatial Modeler Library provided by Sterling Geo.
The models have been donated by Sterling Geo employees. They are free to download and use.
Index
Raster Buffer Around a Binary Image
Active Fire Detection Using SWIR and NIR Band
Sentinel-2 Cloud Removal Model
Sentinel-2 NDVI Model
Sentinel GRD 8-bit Colour Polarimetric Model
Using ERDAS IMAGINE to Import .asc Files
Importing MODIS with NDVI Rescale
Categorised NDVI
Raster to
-
Forum Statistics
8.8k
Total Topics43.5k
Total Posts
-
Latest Posts
-

By yousef2233 · Posted
The issue with handling file addresses has been fixed. 😑 -
 There are many different frequencies of light that reach Earth, some of which are visible to us and others of which are not. Because of its special characteristics, shortwave infrared (SWIR) stands out among these frequencies and is very helpful for Light Detection and Ranging (LIDAR) systems. Like SONAR, which utilizes sound waves to determine distances, LIDAR employs laser pulses. The danger of SWIR waves is that they do not reach the retina through the cornea and lens of the human eye. SWIR is therefore eye-safe and perfect for real-world uses like LIDAR systems. A novel technique for creating silver telluride (Ag₂Te) colloidal quantum dots has been demonstrated by researchers at the Institute of Photonic Sciences (ICFO). In LIDAR systems, quantum dots are employed as light detectors, also known as photodetectors. The new technique overcomes the drawbacks of conventional SWIR photodetectors, which employ hazardous heavy metals like lead or mercury in their quantum dot constituents. A more eco-friendly substitute, silver telluride colloids, has already been studied for application in quantum dots. Despite their potential, a number of barriers prevent them from being widely used. By refining the surface engineering of silver telluride colloidal quantum dots to extract maximum efficiency while being environmentally benign, the current work tackles these issues. Quantum dots and their toxicity The diameters of quantum dots, which are tiny semiconductor particles, range from 2 to 10 nanometers. A human hair's breadth might accommodate about 15,000 quantum dots placed side by side for comparison. A quantum dot contains trapped electrons. The distinctive electrical and optical characteristics observed are caused by these quantum confinement effects. Because of their inherent stability and optoelectronic (light and electrical) qualities, hazardous metals are a desirable choice for their components. Even though there are safer substitutes, such as silver telluride colloids, their efficacy in detecting both strong and dim light is hindered by noise, long reaction times, and a narrow light detection range. Engineering the surface The researchers used two approaches to these problems. They began by refining the synthesis of colloidal quantum dots made of silver telluride. They were able to eliminate surface imperfections on semiconductor particles, which are known to reduce efficiency, by refining the procedure. The invention occurs in the second step, which takes place after synthesis. Following the synthesis, scientists treated the quantum dot's thin layer with silver nitrate. By introducing contaminants into the quantum dots through the application of silver nitrate, the doping procedure modifies the electrical characteristics of the dots. The silver nitrate in this instance transformed the quantum dots from p-type semiconductors to n-type semiconductors. The p and n show whether the current flowing through the material is caused by positive or negative charges. The n-type quantum dots do not have the problem of high dark current and poor performance as the p-type does. Applications of LIDAR that are eye-safe The SWIR photodetector composed of colloidal quantum dots of silver telluride was tested by the researchers. By drastically lowering the dark current, the photodetector improved accuracy and decreased noise. The gadget demonstrated improved light detection efficiency, collecting light of a certain wavelength with a 30% efficiency rate. Additionally, the detector can measure distances precisely because of its fast response time of only 25 nanoseconds. Lastly, a far greater range of light intensities may be handled by the detector. source: interestingengineering
 -
Vacant lots, though overlooked or seen as eyesores by many, represent opportunities. UConn College of Agriculture, Health and Natural Resources doctoral researcher Pan Zhang and Assistant Professor Sohyun Park, both in the Department of Plant Science and Landscape Architecture, have created a framework to help cities and community members assess and prioritize which lots will have the biggest impact—for everyone—if they are repurposed. Their research is published in the journal Sustainability. Due to rapid deindustrialization and white flight, Hartford is home to some of the poorest neighborhoods in the country, and areas of North Hartford were designed as an urban renewal Promise Zone in 2008. Zhang explains the project started in 2018 as part of a class project with retired Associate Professor Kristin Schwab. The class she was taking was tasked by the planners from the City of Hartford blight remediation team along with community stakeholders to evaluate and assess city-owned vacant lots. The city wanted to have a framework to systematically manage the lots and potentially pick sites that were expected to be most suitable, and successful, for regeneration and placemaking purposes. Zhang partnered with Park to continue developing the framework after the semester. Urban greening efforts are underway in other post-industrial cities, like Detroit and Cleveland, but Park says these efforts tend to be driven by single goals, either economic or environmental. The researchers wanted to create a comprehensive framework that could accomplish many goals, and that is how they created the Vacant Land Assessment System (VLAS). These kinds of projects face several challenges, such as zoning restrictions, potential remediation of brownfield sites, ensuring the projects address community needs and avoid gentrification, as well as how to reach consensus on the reuse programs if lands were privately owned. "First, the city gave us a spreadsheet with all the street addresses of their properties and when we started to geocode the inventory, we realized there were spatial patterns that were categorizable," says Zhang. Using publicly available information and geographic information systems (ArcGIS) tools they analyzed features of the properties, geographical distribution, and potential strategies for reclaiming the vacant lots. The researchers analyzed the characteristics of the lots based on their proximity to different facilities, infrastructure, schools, and parks, for example, to assess future reuse opportunities. They organized the properties into four types, or typologies, and categorized them as Row House, Street Corner, Commercial/Industrial, and Main Street. Then reuse programs were designed for each category to create some generalized strategies. "After that, we consulted with the city about which sites to work on in North Hartford. Then we worked with the planners, neighborhood NGOs, and stakeholders to try to apply those sustainable placemaking strategies. We got good feedback and reactions from the public when we presented the final design outcomes," says Zhang. Zhang says the VLAS framework leverages existing spatial data and resources so the tools can be easily used by other planners in any municipality and can help with planning and managing spaces from site to neighborhood to city scales and can also serve as an assessment tool. Another essential quality of the framework is that it links scientific expertise with policymakers and community stakeholders to create a collaborative working environment. Though the project implementing the VLAS framework has not gone forward yet, Zhang hopes that it will one day, "I continued to work in that neighborhood the summer after that project and residents still remember me and that project. It is something the residents were looking forward to." Zhang feels the approach could have lasting ecological impacts as more greening lots could not only increase access to green spaces but also increase connectivity with forests in and around cities. "We want to greenify those lands that have been disregarded and underestimated in the city setting. The existing native trees in those vacant lots might have more potential than people think," says Park. "They might be good for local ecosystems, even though that's not an intact ecosystem, but rather what's called a novel ecosystem where urban wildlife can thrive. Also, actively greenifying those lands helps the community's health and well-being in the long term and may be able to help break the cycle of poverty, and violence that is prevalent in those areas. "Even though this is a small case study, when we can scale up these practices to a broader level, we might be touching upon some societal problems that we have. There might be some implications that we can draw from this research." By using the holistic approach and multi-scale thinking of VLSA, greening vacant lots could be for the common benefit of all. Park stresses that community engagement is key. "Even though this is a research-based, data-driven study, all things that could happen should be involved with members who live in that neighborhood. I think connections from the research to community engagement and participation should be key to making things happen." source: VLAS: Vacant Land Assessment System for Urban Renewal and Greenspace Planning in Legacy Cities
-

-
-
Latest Topics
-
-
Recent Achievements


