- 0 replies
- 1,522 views
- Add Reply
- 0 replies
- 1,425 views
- Add Reply
- 0 replies
- 1,175 views
- Add Reply
- 0 replies
- 1,529 views
- Add Reply
- 0 replies
- 4,044 views
- Add Reply
NASA developing drones to monitor potential volcano eruptions

By Lurker,
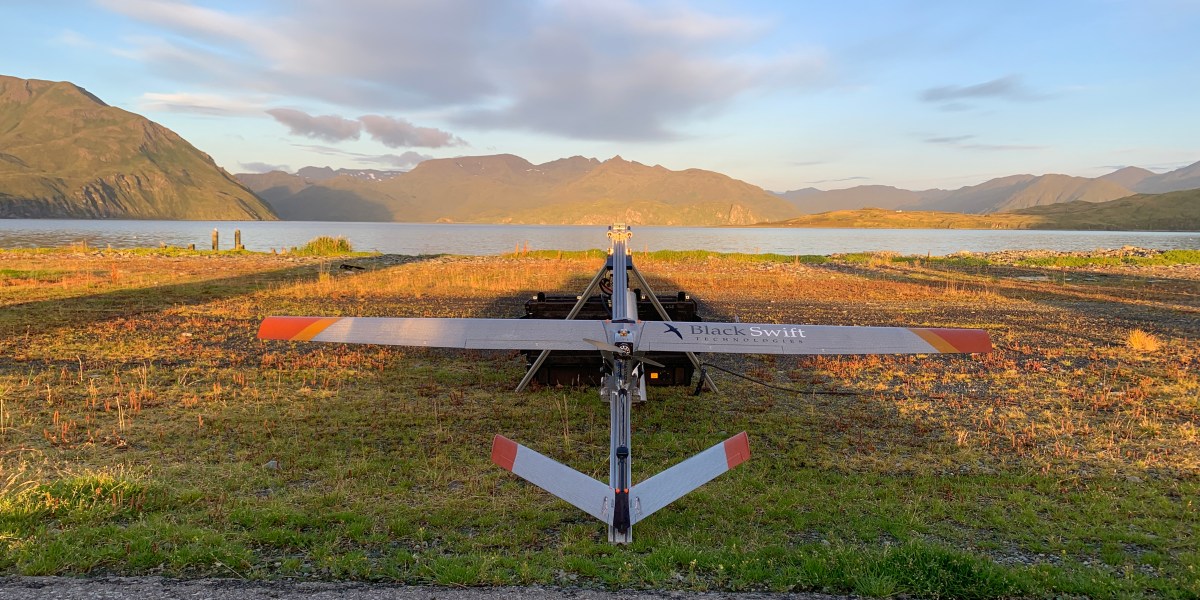
NASA has partnered with other US agencies and a Colorado-based drone manufacturer to create a UAV-based system to observe volcanoes for indications of what otherwise might be unexpected, catastrophic eruptions for local communities.
NASA has long been interested in deploying drones to replace human monitors and small aircraft habitually used for near-range examination of volcano activity and for gathering evidence of approaching eruptions. Tipped off to those by data collected with sensors
Wild New Paper Suggests Earth's Tectonic Activity Has an Unseen Source
By Lurker,
Earth is far from a solid mass of rock. The outer layer of our planet – known as the lithosphere – is made up of more than 20 tectonic plates; as these gargantuan slates glide about the face of the planet, we get the movement of continents, and interaction at the boundaries, not least of which is the rise and fall of entire mountain ranges and oceanic trenches.
Yet there's some debate over what causes these giant slabs of rock to move around in the first place.
Amongst the many hypothe
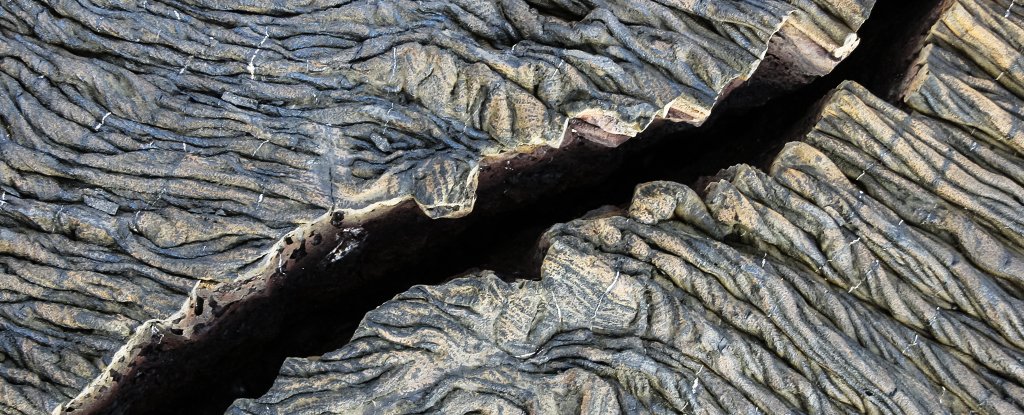
New research strengthens link between glaciers and Earth's 'Great Unconformity'
By Lurker,
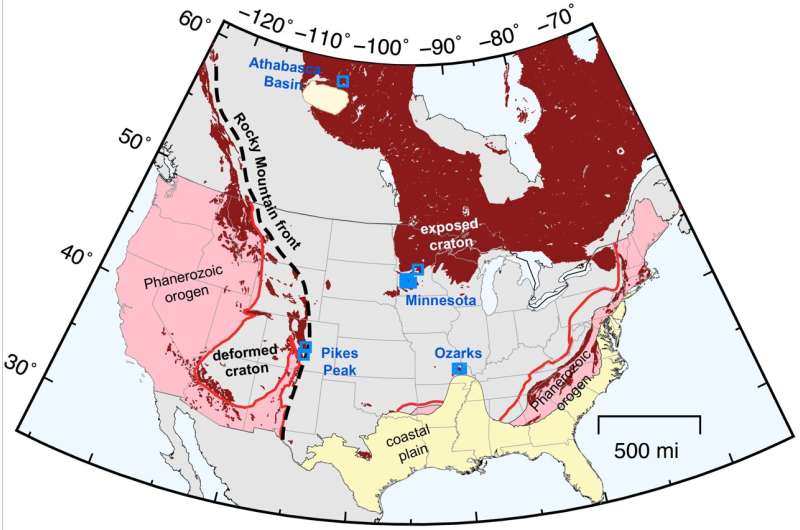
New research provides further evidence that rocks representing up to a billion years of geological time were carved away by ancient glaciers during the planet's "Snowball Earth" period, according to a study published in Proceedings of the National Academy of Sciences.
The research presents the latest findings in a debate over what caused the Earth's "Great Unconformity"—a time gap in the geological record associated with the erosion of rock up to 3 miles thick in areas across the globe.
Map the Oceans, To Save Earth’s Climate
By Lurker,
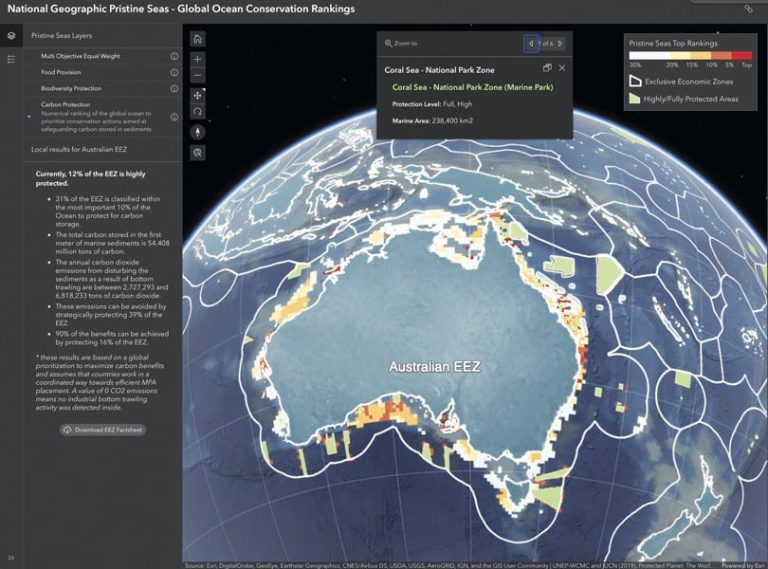
It is worth repeating that scientists know more about Mars, Venus, and the dark side of the moon than they know of Earth’s ocean depths. To date, less than 20 percent of the ocean floor has been mapped—13 percent in just the past four years. But scientists would like to map it all by 2030. It’s an essential undertaking, but it’s going to take dedicated effort, public support, and government funding. Such a project can be accomplished only through dedicated global cooperation.
The payoff sta
Moving Beyond the Geospatial Machine Learning Hype

By ckamusoko,
Land cover classification remains challenging. However, more very high-resolution images are available to create quality reference data. In addition, efforts to improve transparency and accountability in the machine learning model are becoming an important research topic. I have published a book on ‘Data-centric Explainable Machine Learning for Land Cover Classification: A Practical Guide in R.’ The book is for those interested in improving land cover classification using a data-centric explaina
-
Forum Statistics
8.8k
Total Topics43.5k
Total Posts
-
Latest Posts
-

-
A new study introduces the Community Land Active Passive Microwave Radiative Transfer Modeling platform (CLAP)—a unified multi-frequency microwave scattering and emission model designed to revolutionize land surface monitoring. This cutting-edge platform combines active and passive microwave signals to offer potentially accurate simulations of soil moisture and vegetation conditions. By incorporating advanced interaction models for soil and vegetation, CLAP has the potential to address key limitations in existing remote sensing technologies, enabling the improvement of land monitoring precision. The study showcases CLAP's ability to improve microwave signal simulations, especially at high frequencies, marking a major step forward in ecosystem management and climate change research. Microwave remote sensing is essential for land monitoring, providing crucial insights into soil moisture and vegetation health by measuring the microwave radiation and backscatter emitted and scattered by the surface. However, current models rely heavily on zeroth-order radiative transfer theory and empirical assumptions, often overlooking dynamic changes in vegetation and soil properties (structure, moisture and temperature). These limitations result in inconsistencies and reduced accuracy across different frequencies and polarizations. Given these challenges, there is an urgent need for more refined research into the scattering and emission mechanisms of multi-frequency microwave signals to improve the precision and reliability of remote sensing technologies. A team of researchers from the University of Twente has published a paper in the Journal of Remote Sensing, introducing the Community Land Active Passive Microwave Radiative Transfer Modeling platform (CLAP) a multi-frequency microwave scattering and emission model, which integrates advanced soil surface scattering (ATS+AIEM) and vegetation scattering (TVG) models. CLAP incorporates appropriate vegetation structure, dynamic vegetation water content (VWC) and temperature changes, significantly improving upon existing technologies. Additionally, CLAP uncovers the frequency-dependent nature of grassland optical depth and highlights the significant impact of vegetation temperature on high-frequency signals, offering new insights for more accurate vegetation and soil monitoring. The core strength of CLAP lies in its detailed modeling of soil and vegetation components. The team used long-term in situ observations from the Maqu site, including microwave signals, soil moisture, temperature profiles, and vegetation data, to drive CLAP and evaluate the model performance respectively. Results showed that during the summer, CLAP with cylinder parameterization for vegetation representation simulated grassland backscatter at X-band and C-band with RMSE values of 1.8 dB and 1.9 dB, respectively, compared to 3.4 dB and 3.0 dB from disk parameterization. The study also discovered that vegetation temperature variations significantly affect high-frequency signal diurnal changes, while vegetation water content changes primarily influence low-frequency signals. For example, at C-band, vegetation temperature fluctuations had a greater impact on signal changes (correlation coefficient R of 0.34), while at S-band, vegetation water content had a stronger influence (R of 0.46). These findings underscore the importance of dynamic vegetation and soil properties in microwave signal scattering and emission processes, which CLAP accurately reflects. Dr. Hong Zhao, the lead researcher, commented, "The CLAP platform represents a major advancement in microwave remote sensing. By incorporating appropriate vegetation structure, dynamic vegetation and soil water content and temperature into the model, CLAP offers a more accurate representation of microwave signal scattering and emission processes. This innovation will significantly enhance our ability to monitor vegetation and soil conditions, providing more reliable data for ecosystem management and climate change research." The team utilized extensive in situ data from the Maqu site as well as satellite microwave observations. These comprehensive datasets allowed the researchers to rigorously assess CLAP's performance across various frequencies and polarizations, ensuring its accuracy and reliability. The development of CLAP opens new possibilities for the future of microwave remote sensing. This technology can be integrated into upcoming satellite missions such as CIMR and ROSE-L to enhance the precision of soil moisture and vegetation monitoring. Additionally, CLAP can be incorporated into data assimilation frameworks to provide more accurate inputs for land surface models. The widespread application of this technology promises to have a profound impact on global environmental monitoring, agricultural production, and climate change research, supporting sustainable development efforts worldwide. source: https://dx.doi.org/10.34133/remotesensing.0415
-
Researchers at Aalto University have, for the first time, investigated the occurrence of wolverines across the whole of Finland using satellite imagery, field measurements, and snow track observations. The wolverine, a predator typically found in the fells and forests of northern Finland, was classified as endangered in the country already in the 1980s. Although information on the species' historical range is limited, wolverines are known to have inhabited southern Finland as recently as the 19th century. Hunting caused the species to disappear from the region. This study, published in the journal Ecology and Evolution, is the first to provide nationwide data on the types of habitats favored by wolverines as they expand into new areas. "The species is returning to its historical range in southern Finland. According to our research, the deciduous-dominated mixed forests typical of the south may be more important habitats for wolverines than previously thought," says Pinja-Emilia Lämsä, a doctoral researcher at Aalto University. Despite recent population growth, the wolverine's survival remains threatened by its small population size, low genetic viability, and fragmented distribution. However, the study's use of remote sensing and field data offers vital information for safeguarding biodiversity. "Understanding habitats is essential for improving species conservation and management," says Professor Miina Rautiainen, a remote sensing expert at Aalto University. Fragmentation of forest landscapes poses a threat The study found that wolverines tend to favor large, forested areas with deciduous trees. They were rarely observed near recent clear-cuts, whereas older felling sites—about 10 years old—were more attractive. Wolverines also preferred areas with less dense tree cover. Previous studies on wolverine habitats and distribution have mainly focused on mountainous regions with vegetation that differs significantly from the low-lying boreal forests of Finland. According to Pinja-Emilia Lämsä, it is crucial to understand which habitats wolverines prefer specifically in Finland, where forestry practices strongly influence forest structure. "In Finland, the average forest compartment—a uniform section of forest in terms of tree species and site conditions—is relatively small. This can lead to a patchwork-like fragmentation of forest landscapes in forest management decisions. To protect wolverine habitats, mixed-species forest should be prioritized and large, continuous forest areas preserved," Lämsä says. Remote sensing reveals impacts of environmental change The study, conducted in collaboration with the Natural Resources Institute Finland (Luke), combined snow track counts of wolverines with national forest inventory data based on satellite images and field measurements. This approach allowed the researchers to examine the influence of forest characteristics on wolverine presence on a large scale. According to Rautiainen, remote sensing is an excellent tool for studying the distribution of animal species across broad areas, as satellite and aerial images provide increasingly detailed information about changes in forest landscapes and their impacts on wildlife. "In the future, remote sensing will enable us to monitor in even greater detail how, for example, changes in vegetation or other environmental factors in Finland affect animal populations," Rautiainen says. source: https://dx.doi.org/10.1002/ece3.71300
-
We’ve all experienced that moment of frustration when the GPS glitches and you miss an exit on the highway. The team at Tern AI, which is building a low-cost GPS alternative, says that’s because the current technology is limited by its reliance on satellite positioning. Tern AI says it has figured out how to locate the position of a vehicle using only map information and a vehicle’s existing sensor data. The company’s pitch: It’s a cheap system that doesn’t require any additional expensive sensors. “No triangulation, no satellites, no Wi-Fi, nothing. We just figure out where we are as we drive,” Brett Harrison, co-founder and president, told TechCrunch while Cyrus Behroozi, senior software developer at Tern, loaded up the demo on his iPhone. “That’s really game changing because as we move away from triangulation-based, which limits technology, now we have the ability to be fully off that grid.” Harrison says this breakthrough is important for a number of reasons. From a commercial standpoint, companies that rely on GPS — including ride-hail apps to delivery companies — lose time, money, and gas every time their drivers have to double back because of faulty GPS positioning. More importantly, our most critical systems — from aviation to disaster response to precision farming — rely on GPS. Foreign adversaries have already demonstrated that they can spoof GPS signals, which could have catastrophic impacts both on the economy and national security. The U.S. has signaled that it wants to prioritize alternatives to GPS. During his first term, President Donald Trump signed an executive order to reduce reliance on a single source of PNT (positioning, navigation, and timing) services, like GPS. There are also several other initiatives which direct agencies and bodies like the Department of Defense and the National Security Council to ensure resilient PNT by testing and integrating non-GPS technologies. Testing Tern’s system in Austin To start the demonstration, Behroozi connected his 2019 Honda Civic to his phone via Bluetooth, allowing the Tern application to pull in data from the vehicle’s existing sensors. He noted that Tern’s tech can be integrated directly into vehicles, beginning model years 2009 and up. Usually, Tern sets the position manually to speed things up, but for our demo, the team wanted a “cold start.” Behroozi turned off his phone’s location services, so the Tern intelligent system had only a cached map of a 500-square-mile boundary around Austin and vehicle sensors to work with. As the car drove, the system picked up road data to work toward “convergence.” It took roughly 10 minutes for the system to reach full convergence from a cold start because, according to Behroozi, there was traffic so our movements were limited. Harrison assured me convergence usually takes around one to two minutes without a start point, and is immediate with one. Harrison noted that Tern’s system can also localize vehicles in parking garages, tunnels, and on mountains, which GPS struggles to do. Harrison wouldn’t explain exactly how, saying the information is “proprietary.” We drove around for a few more minutes after the system reached full convergence, and I watched as it steadily tracked our precise movements in a way that appeared as good as, and in some cases better than, GPS. That became more apparent when we drove into downtown Austin, where my Google Maps regularly mislocated me throughout the week as I navigated urban streets dotted with towering buildings. Harrison said that Tern’s system is also safer from a privacy perspective. “Our system is a total closed loop,” he said. “Right now, we’re not emitting anything. It’s independently deriving its own position [via on edge computing], so there are no external touchpoints.” source: techcrunch.com
-
-
Latest Topics
-
-
Recent Achievements


