- 2 replies
- 1,721 views
- Add Reply
- 0 replies
- 772 views
- Add Reply
- 0 replies
- 1,009 views
- Add Reply
- 0 replies
- 949 views
- Add Reply
- 3 replies
- 2,493 views
- Add Reply
ESRI and Microsoft

By hariasa,
The other thread was originally about iPod's, and then turned to ESRI and Microsoft so I put it into a new thread if you don't mind.
Couple of years ago, Microsoft became really interested with GIS applications, BING maps, lots of cooperation with GIS suites and also high-end professional software. I can't really name specific ones, but I worked at a Aerial Photography company and most of the software/hardware/drivers they were working with to produce and process the pictures were Microsof
OnYourMap and Blom announce partnership

By Lurker,
OnYourMap and Blom announce partnership and the release of a common high performance mapping platform
OnYourMap and Blom now offer a comprehensive location based platform with services and high quality content for mapping, routing, geocoding and innovative search. This no-compromise platform enables web and mobile portals to boost their presence and revenues while positioning their valuable brand at the forefront and preserving their customers and content.
OnYourMap exclusive internet an
MapMart Cloud Rolls onto the GIS Scene
By Lurker,
MapMart has long been the one-stop shop for traditional geospatial data and imagery acquisition and will remain so. The MapMart Cloud will complement MapMart by offering the same high quality and highly accurate data for consumption via high speed data stream. MapMart Cloud offers hundreds of web services of data sets including Bing Maps from OnTerra Systems, LLC.
MapMart offers a wide variety of U.S. and International geospatial data sets with additional data products coming online daily t
Enhanced map navigation for Mac OS X using the ArcGIS API for JavaScript
By Lurker,
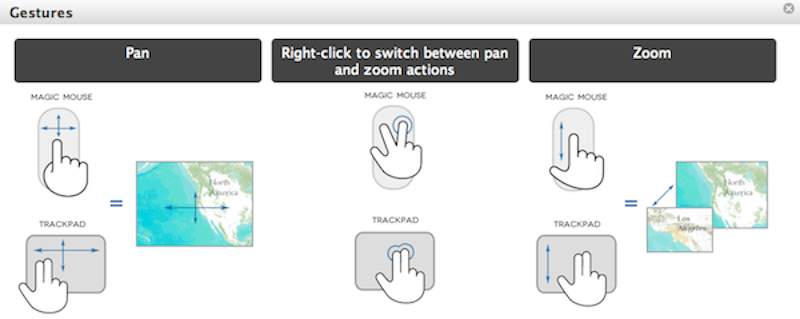
With the release of OS 10.6 Snow Leopard and Lion OS, the Mac Magic Trackpad and Magic Mouse allow you to interact with the system using touch gestures like tap, scroll and swipe. While not all gestures are passed on as native browser events, some gestures emit traditional browser scroll events that enable intuitive and powerful map exploration.
you must have a Mac with OS X 10.6
Wanna study GIS? Click here!

By rahmansunbeam,
Are you planning to study GIS or Remote Sensing? Do you want to be a GIS expert and earn a luck? Here is a huge list of universities and programs from where you can choose what is best for you. Give it a try, maybe the next Goodchild could be you.
US on-campus masters programs
Arizona State University - Masters of Advanced Study in Geographic Information Systems (MAS-GIS)
[hide]
- http://geography.asu.edu/mas-gis
[/hide]
Ball State - Master of Science in Geography, GI Processing Emph
-
Forum Statistics
8.7k
Total Topics43.2k
Total Posts
-
Latest Posts
-
 Hello folks! I am trying to use the Lyzenga Algorithm for estimating the depth of water in shallower areas, probably depths under 8-10 meters of lakes. First of all, how accurate is this algorithm in practice? Secondly, lets say i have the band values. can someone explain me how to retrieve those depths? I am following the "Lyzenga Algorithm for Shallow Water Mapping Using Multispectral Sentinel-2 Imageries in Gili Noko Waters" paper, but there are 3 steps of getting NDWIs, NDCIs and after filtering the Sun Glint Correction, then it finally comes to the depth calculating. it end ups in a formula of following: 𝑧 = 28.32 ∗ 𝑋1 − 36.25 ∗ 𝑋2 + 9.42 ∗ 𝑋3 + 16.35 x1 , x2, x3 are RGB values respectively. What do you guys think? can i just apply this formula ? if not, what is the purpose of all the previous steps, and will they change the rgb values anyways?
 -
Hello folks! I am trying to use the Lyzenga Algorithm for estimating the depth of water in shallower areas, probably depths under 8-10 meters of lakes. First of all, how accurate is this algorithm in practice? Secondly, lets say i have the band values. can someone explain me how to retrieve those depths? I am following the "Lyzenga Algorithm for Shallow Water Mapping Using Multispectral Sentinel-2 Imageries in Gili Noko Waters" paper, but there are 3 steps of getting NDWIs, NDCIs and after filtering the Sun Glint Correction, then it finally comes to the depth calculating. it end ups in a formula of following: 𝑧 = 28.32 ∗ 𝑋1 − 36.25 ∗ 𝑋2 + 9.42 ∗ 𝑋3 + 16.35 x1 , x2, x3 are RGB values respectively. What do you guys think? can i just apply this formula ? if not, what is the purpose of all the previous steps, and will they change the rgb values anyways?
-
 Understanding GIS Mapping GIS Mapping is a technology and process used to capture, store, analyze, manage, and visualize geographic or spatial data. It combines geographical information such as locations and terrain features, with various types of data like environmental, social, economic, and demographic information, to create detailed and layered maps. These maps are powerful tools for understanding and interpreting spatial relationships, patterns, and trends. Components of GIS Mapping Key components of GIS mapping include: 1. Hardware. The hardware is the tangible aspect of GIS mapping technology. This includes computers, GPS devices, drones, and other equipment used to collect, process, and analyze geographic data. 2. Software. GIS mapping provides a platform for creating maps, conducting spatial analyses, and sharing geographic information. 3. Data. Spatial data is the core of GIS mapping. It encompasses information about specific locations, attributes, and relationships. This data can come from various sources, such as satellite imagery, surveys, government databases, or user-generated content. 4. People. Skilled individuals, such as GIS analysts, cartographers, geographers, and geospatial scientists, are essential for using GIS technology effectively. They design, develop, and apply GIS solutions to address specific problems or research questions. GIS mapping allows users to perform a wide range of spatial analyses like measuring distances, determining optimal routes, assessing environmental changes, and identifying patterns within data. Therefore, it has a significant impact on humanitarian assistance and disaster preparedness and response. Now, what does this transformative impact look like? How GIS Mapping Transforms Humanitarian Assistance It Enhances Disaster Response When disasters strike (and they usually do), whether they take the form of a natural catastrophe or a man-made crisis, every second counts. Key decision-makers therefore need adequate data and spatial information to respond proactively. This is where GIS mapping technology shines. Real-time data on the location and extent of a disaster, along with intricate details about affected areas and population distribution, enable aid agencies to make well-informed decisions, coordinate efforts, and manage resources effectively. Crucially, the ability to visualize and analyze information on a map empowers responders to prioritize their actions based on the most pressing needs. This ultimately saves lives. GIS Technology Helps Map Vulnerable Populations In humanitarian work, the overarching goal is to help those who are most in need. Humanitarian assistance, therefore, relies heavily on the ability to identify and map ‘vulnerable’ populations. This is where GIS technologies play a crucial role. GIS mapping provides a powerful tool for identifying vulnerable populations, whether they are refugees fleeing conflict, communities at risk from disease outbreaks, or marginalized groups living in impoverished regions. Therefore, by overlaying geographic data with information on poverty rates, access to healthcare and food security, aid workers can make informed decisions about where and how to allocate resources effectively. This targeted approach ensures that aid reaches the individuals and communities that require it the most. GIS Mapping Provides Real-time Data One of the most remarkable features of GIS mapping in humanitarian aid is its ability to provide real-time data. This is usually in the form of satellite imagery. This capability is particularly crucial in disaster management, where timely and accurate information is of paramount importance. For example, during a hurricane, GIS technology can track the storm’s path, predict areas likely to be impacted and facilitate evacuation planning. It can also assess damage immediately after the event, thereby allowing for a rapid and well-coordinated response. This ‘bird’s eye view’ of disaster-affected areas equips humanitarian workers with the data needed to make informed decisions and deploy resources efficiently. Additionally, with real-time data, there’s flexibility in managing situations on the go. GIS Mapping Helps Track and Monitor Epidemics and Disease Outbreaks GIS mapping plays a pivotal role in monitoring and controlling disease outbreaks. During epidemics such as the Ebola crisis in West Africa, GIS technology tracked the spread of the disease, identified hotspots of infection and helped health workers isolate cases and trace contacts. These insights were crucial in containment efforts and ultimately contributed to the control of the epidemic. By visualizing the geographic spread of the disease, humanitarian organizations could direct resources to the areas that needed them most, effectively limiting the outbreak’s reach. Enroll in: GIS in Monitoring and Evaluation Course It Enhances Disaster Risk Reduction and Management In the field of disaster management, preparedness is often the best form of defense. GIS mapping aids in identifying disaster-prone regions, allowing communities to plan for potential crises. By creating detailed hazard maps, which include flood risk assessments, earthquake-prone areas, and other environmental hazards, this technology helps in developing preparedness plans and mitigating the impact of disasters. The ability to visualize potential risks empowers communities to take proactive measures, such as reinforcing infrastructure, developing evacuation plans, and building resilient shelters. Enroll in: GIS For WASH Programmes Course Crowdsourced Mapping Crowdsourced mapping has proven to be a remarkable revelation to humanitarian aid. It’s a collaborative approach to creating and updating maps and geographic information using contributions from the general public. This method relies on the collective efforts of volunteers who provide geographic data, typically using digital tools. Initiatives like OpenStreetMap have harnessed these efforts to contribute data on roads, buildings, and infrastructure in disaster-affected areas. This grassroots approach has been instrumental in improving the accuracy and completeness of maps in areas that were previously unmapped. Crucially, humanitarian organizations can then use this data for response efforts, making it a remarkable example of how technology and global collaboration can save lives. Therefore, this collective action not only aids in immediate response but also contributes to the resilience of affected communities. Click HERE to read more.
 -
Multimodal machine learning models have been surging in popularity, marking a significant evolution in artificial intelligence (AI) research and development. These models, capable of processing and integrating data from multiple modalities such as text, images, and audio, are of great importance due to their ability to tackle complex real-world problems that traditional unimodal models struggle with. The fusion of diverse data types enables these models to extract richer insights, enhance decision-making processes, and ultimately drive innovation. Among the burgeoning applications of multimodal machine learning, Visual Question Answering (VQA) models have emerged as particularly noteworthy. VQA models possess the capability to comprehend both images and accompanying textual queries, providing answers or relevant information based on the content of the visual input. This capability opens up avenues for interactive systems, enabling users to engage with AI in a more intuitive and natural manner. However, despite their immense potential, the deployment of VQA models, especially in critical scenarios such as disaster recovery efforts, presents unique challenges. In situations where internet connectivity is unreliable or unavailable, deploying these models on tiny hardware platforms becomes essential. Yet the deep neural networks that power VQA models demand substantial computational resources, rendering traditional edge computing hardware solutions impractical. Inspired by optimizations that have enabled powerful unimodal models to run on tinyML hardware, a team led by researchers at the University of Maryland has developed a novel multimodal model called TinyVQA that allows extremely resource-limited hardware to run VQA models. Using some clever techniques, the researchers were able to compress the model to the point that it could run inferences in a few tens of milliseconds on a common low-power processor found onboard a drone. In spite of this substantial compression, the model was able to maintain acceptable levels of accuracy. To achieve this goal, the team first created a deep learning VQA model that is similar to other state of the art algorithms that have been previously described. This model was far too large to use for tinyML applications, but it contained a wealth of knowledge. Accordingly, the model was used as a teacher for a smaller student model. This practice, called knowledge distillation, captures much of the important associations found in the teacher model, and encodes them in a more compact form in the student model. In addition to having fewer layers and fewer parameters, the student model also made use of 8-bit quantization. This reduces both the memory footprint and the amount of computational resources that are required when running inferences. Another optimization involved swapping regular convolution layers out in favor of depthwise separable convolution layers — this further reduced model size while having a minimal impact on accuracy. Having designed and trained TinyVQA, the researchers evaluated it by using the FloodNet-VQA dataset. This dataset contains thousands of images of flooded areas captured by a drone after a major storm. Questions were asked about the images to determine how well the model understood the scenes. The teacher model, which weighs in at 479 megabytes, was found to have an accuracy of 81 percent. The much smaller TinyVQA model, only 339 kilobytes in size, achieved a very impressive 79.5 percent accuracy. Despite being over 1,000 times smaller, TinyVQA only lost 1.5 percent accuracy on average — not a bad trade-off at all! In a practical trial of the system, the model was deployed on the GAP8 microprocessor onboard a Crazyflie 2.0 drone. With inference times averaging 56 milliseconds on this platform, it was demonstrated that TinyVQA could realistically be used to assist first responders in emergency situations. And of course, many other opportunities to build autonomous, intelligent systems could also be enabled by this technology. source: hackster.io
-
-
Latest Topics
-
-
Recent Achievements