- 0 replies
- 9,638 views
- Add Reply
- 1 reply
- 1,920 views
- Add Reply
- 0 replies
- 1,931 views
- Add Reply
- 0 replies
- 1,487 views
- Add Reply
- 1 reply
- 5,396 views
- Add Reply
Mountaintop removal worse for endangered species than initially thought

By Lurker,

A new study published today by journal PLOS ONE has revealed that mountaintop removal mining poses a more serious and widespread threat to endangered species and people than was previously understood. The researchers from Defenders of Wildlife's Center for Conservation Innovation (CCI) and conservation technology nonprofit SkyTruth, combine water-quality data with satellite imagery of mountaintop removal mining activity to estimate the full extent of water-quality degradation attributable to the
Calculation of the TSAVI vegetation index

By achraf98,
Hi. I am working on a remote sensing project about land degradation. I want to calculate TSAVI using a Landsat-8 image but I can't find how the a and b (slope and intercept) parameters are calculated. I only know that the variable X=0.08 according to the litterature. Can someone help me?
Kleos commits to build and launch fourth satellite cluster
By Lurker,
Kleos Space S.A (ASX:KSS, Frankfurt:KS1, Kleos or Company), a space-powered Radio Frequency Reconnaissance data-as-a-service (DaaS) company, has signed new contracts with satellite builder Innovative Solutions in Space B.V. (ISISPACE) and global launch services provider Spaceflight Inc to build and manage the launch its fourth satellite cluster of four satellites, the Observer Mission (KSF3) mid-2022.
Kleos Space CEO Andy Bowyer said, “We are rapidly building our constellation, utilising fu
NOAA's surfing drone captured footage inside Hurricane Sam
By Lurker,
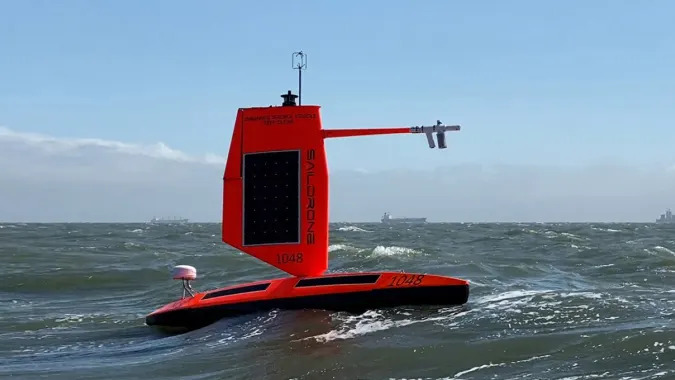
The National Oceanic and Atmospheric Administration has shared what it says are the first images and video captured inside a hurricane by a surface drone. The agency placed the Saildrone Explorer SD 1045 in the path of the category-four Hurricane Sam. The saildrone overcame 50-foot waves and winds at speeds topping 120 miles per hour to capture data from the hurricane and offer a new perspective into such storms.
The device has a special “hurricane wing” to help it survive the intense wind
asking question about geopands

By zolfa,
hello
how can i solve the problem of geopandas installation ?
i can not install geopandas in anaconda
would possible to help me ?
-
Forum Statistics
8.7k
Total Topics43.2k
Total Posts
-
Latest Posts
-
 Hello folks! I am trying to use the Lyzenga Algorithm for estimating the depth of water in shallower areas, probably depths under 8-10 meters of lakes. First of all, how accurate is this algorithm in practice? Secondly, lets say i have the band values. can someone explain me how to retrieve those depths? I am following the "Lyzenga Algorithm for Shallow Water Mapping Using Multispectral Sentinel-2 Imageries in Gili Noko Waters" paper, but there are 3 steps of getting NDWIs, NDCIs and after filtering the Sun Glint Correction, then it finally comes to the depth calculating. it end ups in a formula of following: 𝑧 = 28.32 ∗ 𝑋1 − 36.25 ∗ 𝑋2 + 9.42 ∗ 𝑋3 + 16.35 x1 , x2, x3 are RGB values respectively. What do you guys think? can i just apply this formula ? if not, what is the purpose of all the previous steps, and will they change the rgb values anyways?
 -
 Интересно: [url=https://autoplenka.com/product-tag/sine-zelenyj/]antiskol[/url] или [url=https://autoplenka.com]пленка на лобовое стекло автомобиля[/url] Может быть полезным: https://autoplenka.com/product/nabor-iz-3-myagkih-vygonok-trapecziya/ или [url=https://autoplenka.com]пленка для тонировки стекол автомобиля[/url] Ещё можно узнать: [url=http://yourdesires.ru/home-and-family/cookery/232-kak-prigotovit-shpikachki-v-domashnih-usloviyah.html]шпикачки дома[/url]
 -
Интересно: [url=https://autoplenka.com/product/vygonka-black-axe-64-h-78/]тонировочная пленка llumar[/url] или [url=https://autoplenka.com/product-category/anti-gravity/antigravijnye-gibridnye-plenki/]установка антигравийной пленки на автомобиль[/url] Может быть полезным: https://autoplenka.com/product/nozh-tajima-lc-300/ или [url=https://autoplenka.com/product-category/windshield/]оклейка архитектурной пленкой[/url] Ещё можно узнать: [url=http://yourdesires.ru/it/windows/29-sbros-parametrov-brauzera-internet-explorer.html]сброс internet explorer 11[/url]
-
 Understanding GIS Mapping GIS Mapping is a technology and process used to capture, store, analyze, manage, and visualize geographic or spatial data. It combines geographical information such as locations and terrain features, with various types of data like environmental, social, economic, and demographic information, to create detailed and layered maps. These maps are powerful tools for understanding and interpreting spatial relationships, patterns, and trends. Components of GIS Mapping Key components of GIS mapping include: 1. Hardware. The hardware is the tangible aspect of GIS mapping technology. This includes computers, GPS devices, drones, and other equipment used to collect, process, and analyze geographic data. 2. Software. GIS mapping provides a platform for creating maps, conducting spatial analyses, and sharing geographic information. 3. Data. Spatial data is the core of GIS mapping. It encompasses information about specific locations, attributes, and relationships. This data can come from various sources, such as satellite imagery, surveys, government databases, or user-generated content. 4. People. Skilled individuals, such as GIS analysts, cartographers, geographers, and geospatial scientists, are essential for using GIS technology effectively. They design, develop, and apply GIS solutions to address specific problems or research questions. GIS mapping allows users to perform a wide range of spatial analyses like measuring distances, determining optimal routes, assessing environmental changes, and identifying patterns within data. Therefore, it has a significant impact on humanitarian assistance and disaster preparedness and response. Now, what does this transformative impact look like? How GIS Mapping Transforms Humanitarian Assistance It Enhances Disaster Response When disasters strike (and they usually do), whether they take the form of a natural catastrophe or a man-made crisis, every second counts. Key decision-makers therefore need adequate data and spatial information to respond proactively. This is where GIS mapping technology shines. Real-time data on the location and extent of a disaster, along with intricate details about affected areas and population distribution, enable aid agencies to make well-informed decisions, coordinate efforts, and manage resources effectively. Crucially, the ability to visualize and analyze information on a map empowers responders to prioritize their actions based on the most pressing needs. This ultimately saves lives. GIS Technology Helps Map Vulnerable Populations In humanitarian work, the overarching goal is to help those who are most in need. Humanitarian assistance, therefore, relies heavily on the ability to identify and map ‘vulnerable’ populations. This is where GIS technologies play a crucial role. GIS mapping provides a powerful tool for identifying vulnerable populations, whether they are refugees fleeing conflict, communities at risk from disease outbreaks, or marginalized groups living in impoverished regions. Therefore, by overlaying geographic data with information on poverty rates, access to healthcare and food security, aid workers can make informed decisions about where and how to allocate resources effectively. This targeted approach ensures that aid reaches the individuals and communities that require it the most. GIS Mapping Provides Real-time Data One of the most remarkable features of GIS mapping in humanitarian aid is its ability to provide real-time data. This is usually in the form of satellite imagery. This capability is particularly crucial in disaster management, where timely and accurate information is of paramount importance. For example, during a hurricane, GIS technology can track the storm’s path, predict areas likely to be impacted and facilitate evacuation planning. It can also assess damage immediately after the event, thereby allowing for a rapid and well-coordinated response. This ‘bird’s eye view’ of disaster-affected areas equips humanitarian workers with the data needed to make informed decisions and deploy resources efficiently. Additionally, with real-time data, there’s flexibility in managing situations on the go. GIS Mapping Helps Track and Monitor Epidemics and Disease Outbreaks GIS mapping plays a pivotal role in monitoring and controlling disease outbreaks. During epidemics such as the Ebola crisis in West Africa, GIS technology tracked the spread of the disease, identified hotspots of infection and helped health workers isolate cases and trace contacts. These insights were crucial in containment efforts and ultimately contributed to the control of the epidemic. By visualizing the geographic spread of the disease, humanitarian organizations could direct resources to the areas that needed them most, effectively limiting the outbreak’s reach. Enroll in: GIS in Monitoring and Evaluation Course It Enhances Disaster Risk Reduction and Management In the field of disaster management, preparedness is often the best form of defense. GIS mapping aids in identifying disaster-prone regions, allowing communities to plan for potential crises. By creating detailed hazard maps, which include flood risk assessments, earthquake-prone areas, and other environmental hazards, this technology helps in developing preparedness plans and mitigating the impact of disasters. The ability to visualize potential risks empowers communities to take proactive measures, such as reinforcing infrastructure, developing evacuation plans, and building resilient shelters. Enroll in: GIS For WASH Programmes Course Crowdsourced Mapping Crowdsourced mapping has proven to be a remarkable revelation to humanitarian aid. It’s a collaborative approach to creating and updating maps and geographic information using contributions from the general public. This method relies on the collective efforts of volunteers who provide geographic data, typically using digital tools. Initiatives like OpenStreetMap have harnessed these efforts to contribute data on roads, buildings, and infrastructure in disaster-affected areas. This grassroots approach has been instrumental in improving the accuracy and completeness of maps in areas that were previously unmapped. Crucially, humanitarian organizations can then use this data for response efforts, making it a remarkable example of how technology and global collaboration can save lives. Therefore, this collective action not only aids in immediate response but also contributes to the resilience of affected communities. Click HERE to read more.
-
-
Latest Topics
-
-
Recent Achievements
-